

Problems in Pharmaceutical Industry
17.05.2014
Pharmaceutics is included in the number of industries which provide population with socially important products, in the light of which its correspondence to the modern level of technology development is of special significance. However, at present there are quite a lot of problems in pharmaceutical industry of Russia. First of all, technical depreciation of many production works, absence of raw materials of Russian origin, the range of products not corresponding to modern trends, growth of production costs following rises of prices for energy resources and competition with foreign manufacturers. Besides, the pharmaceutical market sees a high share of falsified and counterfeit products.
Despite the fact that about two thirds of the medicine market in natural terms are owned by Russian manufacturers, their share in the total cost is several times lower. Such a situation exists because of existing expensive branded medicine. Low cost of Russian medicine deprives manufacturers of the opportunity to invest into updating of technologies and to conduct research for introduction of new medicine to the market.
Let’s examine the market of vitamin products: a shift of priorities towards a healthy lifestyle caused an increase of demand for vitamin products. Russian manufacture of provitamin products, vitamin products and their derivatives in 2013 amounted to 172 tons, while more than 7 thousand tons of products were imported from abroad.
Three quarters of imported provitamin and vitamin products in 2013 were supplies from four countries (32% - China, 22% - Germany, 13% - France, 10% - Switzerland). At that, China supplies cheap products: with the average cost of a ton of 21 thousand dollars, products from China cost only 5 thousand. The most expensive products are supplied to Russia from Ukraine, Israel, Italy, Croatia, and Canada. One should note that China is the main supplier of pharmaceutical products to the Russian market.
Almost 60% of import in natural terms in January-October of 2013 was for vitamins С and Е. Vitamins of group В and vitamin А made up 14% of the total volume. 28% was the share of other vitamins and concentrates.
Schedule 1. Structure of Russian import of vitamin products and their derivatives in natural terms in January-October of 2013, %
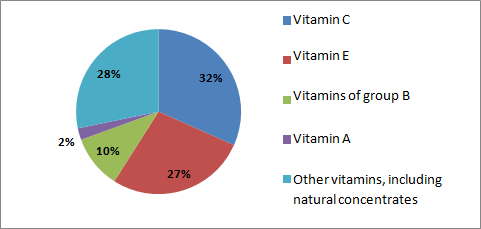
Source: Customs Service of RF
For more information, please, see “Business Plan of a Pharmaceutical Enterprise (with a Financial Model)” by Intesco Research Group.
The given figures were calculated by analysts of Intesco Research Group based on official statistics.